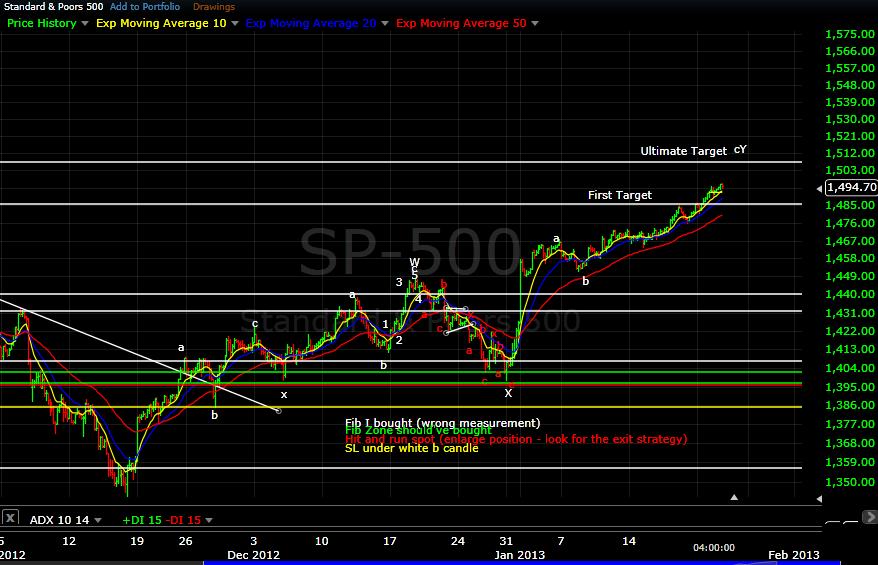
The market is putting in some reversal notifications within a band of fibonacci resistance areas, which is not bullish. Looking to exit the other half of my long position.
We'll start with the SP-500 w/ ATR. It has approached a trendline that has marked previous tops and is looking to reverse.
The next chart shows the ratio of SP-500 and TLT: It is outside it's upper BB and a close back inside gives a sell signal. This signal has produced small moves, but it has also marked tops.
The RUT gave and ADX sell signal and the DI's crossed above and below their associated trend lines.
To be fair, the above chart (RUT) doesn't always mark the top and a higher high could be made. In my experience that higher high is only 15-30 points above the rollover mark, so your max drawdown would be 30 pts.
All of this is going on within my golden Weekly S/R chart:
We must consider this as a large reversal point.
About this blog:
CURRENT MARKET TREND: Down on 1/24/2020
Wednesday, January 30, 2013
Monday, January 28, 2013
Swing Trend Indicator
The swing trend indicator is pushing up against two current trend channel lines. This usually results in a pullback for the SP-500, but the trend remains bullish.
Saturday, January 26, 2013
An Update on the future of the blog
I am in the process of re-focusing my efforts, but this blog shouldn't suffer. In the future I will post real time FOREX trades on a basis of 3-7 times per month as well as post swing trades which should last from a minimum of 3 weeks to multiple months.
REASONS: I believe most people do not wish to day trade, so why waste time posting multiple trades per day. I don't even daytrade much.
The FOREX trades will usually consist of a buy/sell signal trade that will last between 1-3 days. You won't need to monitor the trade, which I think is good for people who have day jobs or a life.
The market generally trends, so there's no reason we need to over-trade to try to capture every up and down. In fact, the majority of "losses" or losing out on gains is caused by over-trading. We'll keep this a simple long or short multi-week blog. I may even post a giant green up arrow or giant red down arrow on the home page with the direction I think the market is moving.
REASONS: I believe most people do not wish to day trade, so why waste time posting multiple trades per day. I don't even daytrade much.
The FOREX trades will usually consist of a buy/sell signal trade that will last between 1-3 days. You won't need to monitor the trade, which I think is good for people who have day jobs or a life.
The market generally trends, so there's no reason we need to over-trade to try to capture every up and down. In fact, the majority of "losses" or losing out on gains is caused by over-trading. We'll keep this a simple long or short multi-week blog. I may even post a giant green up arrow or giant red down arrow on the home page with the direction I think the market is moving.
Wednesday, January 23, 2013
An area of CAUTION
On January 8th I told you that the market was still bullish, and here we are up at 1493 and the charts are showing caution signals. All the daily charts reside within bull territory, but they are starting to show a couple of cracks. We'll first start with the SP-500 daily chart and where I think we are in the Elliott Wave count.
We are currently within the area where, based on the wave count, there are some solid resistances. If the count is correct a reversal in this area is highly likely.
The daily ADX chart hasn't provided a reliable signal since the buy at 1260, but it would've kept you with the overall trend. The +DI is still moving above it's current uptrend line, but the -DI has been producing positive divergences at the last 3 tops.
The daily MACD is still above it's uptrend line, but tested the longer term negative div line today. Also, the MACD Histo is showing negative div.
RSI above uptrend. When it breaks that uptrend line it will cause a Change In Trend.
As stated above, all of the daily indicators are still in the bull zone, including the swing trend indicator. The Swing Trend Indicator broke above a resistance line and turned full bull mode. It will take a price movement under the 3 and 10 dma's to put it on sell.
A fellow called D2K introduced me to the following chart which I modified to include the ADX for timing purposes. The signal comes once the horizontal line is crossed and then the price puts in a lower ADX reading than the previous day. This has not occurred yet, so it's still on buy (although I wouldn't be buying or adding to my position at the current time).
Next we'll move on to some shorter term charts and some bearish chart news. Once again, it is showing the area where the market should roll over if the count is correct.
Here is my current count on the hourly SP-500 chart.
The ADX has approached an area where the market will generally reverse trend. It's still the same setup, once the ADX gets to either the 35 or 40 mark then prints a lower level issues the buy or sell signal. There is a possibility that the -DI is putting in a positive divergence (which is bearish).
Swinging back out to a daily chart, the MO is putting in negative divergence to the new index highs, which is another reason for some caution here.
Summary:
Daily Trend = Bullish (but I believe caution is warranted here)
Hourly Trend = Bullish, but close to a reversal
We are currently within the area where, based on the wave count, there are some solid resistances. If the count is correct a reversal in this area is highly likely.
The daily ADX chart hasn't provided a reliable signal since the buy at 1260, but it would've kept you with the overall trend. The +DI is still moving above it's current uptrend line, but the -DI has been producing positive divergences at the last 3 tops.
The daily MACD is still above it's uptrend line, but tested the longer term negative div line today. Also, the MACD Histo is showing negative div.
RSI above uptrend. When it breaks that uptrend line it will cause a Change In Trend.
As stated above, all of the daily indicators are still in the bull zone, including the swing trend indicator. The Swing Trend Indicator broke above a resistance line and turned full bull mode. It will take a price movement under the 3 and 10 dma's to put it on sell.
A fellow called D2K introduced me to the following chart which I modified to include the ADX for timing purposes. The signal comes once the horizontal line is crossed and then the price puts in a lower ADX reading than the previous day. This has not occurred yet, so it's still on buy (although I wouldn't be buying or adding to my position at the current time).
Next we'll move on to some shorter term charts and some bearish chart news. Once again, it is showing the area where the market should roll over if the count is correct.
Here is my current count on the hourly SP-500 chart.
The ADX has approached an area where the market will generally reverse trend. It's still the same setup, once the ADX gets to either the 35 or 40 mark then prints a lower level issues the buy or sell signal. There is a possibility that the -DI is putting in a positive divergence (which is bearish).
Swinging back out to a daily chart, the MO is putting in negative divergence to the new index highs, which is another reason for some caution here.
Summary:
Daily Trend = Bullish (but I believe caution is warranted here)
Hourly Trend = Bullish, but close to a reversal
Tuesday, January 8, 2013
Market is still bullish
I always base my EW counts off a certain set of indicators including the most valuable to my counts, my Swing Trend Indicator. It gave a caution sell signal, but remained bullish throughout. The caution sell provided us with an uptrend line identifying when the uptrend should end unless the move is going to become a full-blown bull move - as it has in the past.
The indicator is coming up to an important resistance line and the uptrend line on the lower indicator says this bull move has to end by Friday or it will most likely turn into a full bull trend.
Next we'll drop down to the other daily charts with indicators. The latest down move gave us trendlines that should show us when the uptrend ends (once the indicators cross below these lines)
SP-500 MACD
SP-500 RSI Had another bullish CIT recently
SP-500 Stoch RSI - Still in bull zone
The next hourly chart shows we were due for a pullback solely based on the ADX. If the 23.6 retrace was the extent of the pullback, which I believe it was today, then the pullback is MOST LIKELY a B wave.
Sunday, December 30, 2012
Another CIT - Trend now BEARISH
This past week we had a change in trend from the December 17th bullish CIT. All daily indicators are now bearish, and the Swing Trend Indicator has flashed a cautious sell.
The charts, starting with the ADX which hasn't given a signal since a BUY on June 6th. The only signal this chart shows is the cross of the -DI above the +DI, however that ADX is below 20 which means the market isn't trending strongly.
Stoch RSI 34 went bearish on Friday, December 21st with a trendline break.
Daily RSI went bearish on the 21st with a CIT signal
Daily MACD also broke it's trendline and the Histo has gone negative
We must be cognizant of longer term charts (weekly) which are still bullish. The weekly RSI on the SP-500 sits on trendline support
And the weekly MACD is still fully in the bullish zone
Forgot to mention the Swing Trend Indicator (Daily) - Price has dropped below the 3dsma, but not below the 10dsma which would issue the full sell signal.
I had a short position going into this week. I covered those positions this week and went long. I didn't like the price action off the low so cut that trade and went into the weekend flat. I will be looking to get short next week to play the change in trend. I may get whipsawed a bit getting into this position, but will accept the drawdown and set my stops appropriately.
Peace,
Jim
The charts, starting with the ADX which hasn't given a signal since a BUY on June 6th. The only signal this chart shows is the cross of the -DI above the +DI, however that ADX is below 20 which means the market isn't trending strongly.
Stoch RSI 34 went bearish on Friday, December 21st with a trendline break.
Daily RSI went bearish on the 21st with a CIT signal
Daily MACD also broke it's trendline and the Histo has gone negative
We must be cognizant of longer term charts (weekly) which are still bullish. The weekly RSI on the SP-500 sits on trendline support
And the weekly MACD is still fully in the bullish zone
Forgot to mention the Swing Trend Indicator (Daily) - Price has dropped below the 3dsma, but not below the 10dsma which would issue the full sell signal.
I had a short position going into this week. I covered those positions this week and went long. I didn't like the price action off the low so cut that trade and went into the weekend flat. I will be looking to get short next week to play the change in trend. I may get whipsawed a bit getting into this position, but will accept the drawdown and set my stops appropriately.
Peace,
Jim
Monday, December 17, 2012
CIT - Change In Trend
The latest dip in the SP-500 has given us our CIT line on the daily RSI. Do not expect a change in trend until this line is broken.
Wednesday, December 12, 2012
***New Trade Alert***
Sell AUD/USD at the market. SL for entire order is 1.06200, take profit 1.000 (subject to revision based on short term counts)
Setup chart:
Setup chart:
Tuesday, December 11, 2012
State of the Markets
I am still bullish the US equity markets until early 2013 (perhaps as soon as January). I've purposely left Elliott Wave labeling off the following charts so I don't turn people away who may not trust them. The first chart is the daily SP-500 with two simple moving averages, the 19 and 39. This is basically like putting a macd in the middle of your chart.
Notice there has yet to be a bullish cross, but I suspect prices will come down to the 1392 level to sync these MA's back up before we can proceed with another rise in the SP-500.
My favorite indicator, the ADX. Maybe because I've made so much money just using this for long and short entries. We have NOT received an ADX signal since the buy at 1260. It was getting close to a sell signal when we were up testing 1470, but no. Recently we had a bullish DI cross, but as seen from the chart that tends to whipsaw. Technically, we are still on ADX buy since 1260, so that's bullish.
Stoch RSI became bullish on Monday, November 19th. It will not turn bearish until we drop below the red line on the chart.
My Swing Trend Indicator is still bullish as of today.
With all of this daily information I have to remain bullish at this time. I am looking for a dip to the 1392 area in the SP-500 in the coming week or two, but I think that will be another buying opportunity for now. I try not to look very far into the future because the future is always changing. We need to adapt on a daily basis, thus I look at daily charts. For now they remain bullish.
Peace,
Jim
Notice there has yet to be a bullish cross, but I suspect prices will come down to the 1392 level to sync these MA's back up before we can proceed with another rise in the SP-500.
My favorite indicator, the ADX. Maybe because I've made so much money just using this for long and short entries. We have NOT received an ADX signal since the buy at 1260. It was getting close to a sell signal when we were up testing 1470, but no. Recently we had a bullish DI cross, but as seen from the chart that tends to whipsaw. Technically, we are still on ADX buy since 1260, so that's bullish.
Stoch RSI became bullish on Monday, November 19th. It will not turn bearish until we drop below the red line on the chart.
My Swing Trend Indicator is still bullish as of today.
With all of this daily information I have to remain bullish at this time. I am looking for a dip to the 1392 area in the SP-500 in the coming week or two, but I think that will be another buying opportunity for now. I try not to look very far into the future because the future is always changing. We need to adapt on a daily basis, thus I look at daily charts. For now they remain bullish.
Peace,
Jim
Saturday, September 15, 2012
Chart Update
My internal clock is still a little off thanks to my recent trip, so I've had time to go over some charts early this morning. All my daily indicators are still bullish since the buy signal in June, so I still have to post bullish charts that corroborate the bullish scenario playing out.
I'll start with a chart of my Swing Trend Indicator, which hasn't even had a 3/10 MA cross since this rally began. It remains on buy and is even increasing the slope of it's rise. I use this indicator, along with others, to help keep track of the EW count.
My daily Elliott Wave count - Bull trend with an upward bias
$SPX:TLT Weekly chart with bollinger bands. Bullish while above middle band, bearish below.
And finally, my take on oil. I'll be looking to initiate a short position near 105.
In addition to these charts, I will post an updated S/R Chart showing that we broke above the close resistance levels. Current resistance levels lie roughly 30-40 points higher than we are now.
So currently I am still bullish, but that can change at any time. If I see something that changes my view/stance, I'll be sure to post an update. Stay tuned.
Peace,
Jim
Subscribe to:
Posts (Atom)