

Unbiased Forex and Equity Swing Trades
Friday, August 30, 2013
Thursday, August 29, 2013


Wednesday, August 28, 2013

USD/JPY
Since the markets are just grinding today, I'm getting some updates in. I believe USD/JPY put in a wave 1 or A leading diagonal to the downside which was just retraced in wave 2 or B. If this count is correct, we can short anywhere in here with a Stop-Loss at 99.20 and downside projections of 93.40 for a C wave and 90 for a 3 wave.
Setup Chart:

Setup Chart:

FB Update
FB is going up to finish wave v of 5 of green 3. 42.50 looks like the likely target before it drops in green wave 4.

FB 080113:


FB 080113:

Intra-Day Update
The DJIA and the SP-500 cash market both found interim bottoms in solid Fib Support Zones (FSZ). The move off the lows isn't overly impressive, yet. Stops should be set at the previous lows of 1627 for the SP-500 and 14,760 for the DJIA. Conditional sell orders should also be placed at these levels in case the move up I have labelled as 4 was actually a B wave. With the sell order in place we should be able to capture the third wave of C down.
Charts:


Charts:


Charts from yesterday so you know I expected bounces here and am not blowing smoke up your ass like most internet posters.


Tuesday, August 27, 2013
Fourth Wave Analysis
Wave 4's retrace relationships all pertain to waves 1,2 and 3. Most of the time I will use waves 1+3, wave 3 and wave 2 for analysis of the fourth wave. People are wrong to assume that 4th waves don't typically retrace more than they should and that's why most EWT analysis is wrong. In my research I've noted that 60% of the time, the 4th wave will retrace 30-50% of the third wave, which gives me slightly better odds than a coin flip (60 v. 50). But when it holds that level I consider it within the normal tolerance of a fourth wave. Especially if you look at something like the DJIA which had a weak relative bounce to the ride in the RUT, SP-500 and Nasdaq.

In my opinion, and I'm talking my book here since I bought SPY calls today, the SP-500 completed it's 4th wave at a perfect 50% retracement of wave 3, within the 60% odds range of 30-50% retracement of 3. Therefore, on my charts, it's labeled a 4.
Analysis: 15% has a 24% - 29% Retrace of 3
60% from 30%-50%
15% from 51%-62%
10% Greater than 62%
Analysis: 15% has a 24% - 29% Retrace of 3
60% from 30%-50%
15% from 51%-62%
10% Greater than 62%
Chart:

EOD Update
The ES and SP-500 Cash Market both closed at noted FSZ. Either the count is correct and the market will bounce tomorrow, or the count is wrong and it won't. Guess we'll find out tomorrow. We nearly caught the high in GDX when we bought the September puts, those are already well ITM (buying with GDX up 1.5% and closed over 4% red). The SPY calls aren't doing so hot as of market close.
If the market holds todays lows, I would expect a rebound to 1670-80 by September 9th-10th.


If the market holds todays lows, I would expect a rebound to 1670-80 by September 9th-10th.

BONUS CHART: Watch for a bounce at 277 for AMZN

And Trades From Yesterday and Today: Sold Puts purchased yesterday in IWM, NFLX and CMG, picked up puts in GDX and Calls in SPY.

DJIA Setup Chart
The DJIA is dropping to test some Fib Support Zones (FSZ). The first zone to watch is 14,770-14,820 and the second being 14,644-14,684. It has already tested within the first support zone, and I expect that will hold.
CHART:

CHART:

Market Update
The DJIA and SP-500 are completing their fifth waves of either A or 1 down. We should see a retrace up to 1670-80 in the SP-500 before we get short again. I have purchased SPY September 165 Calls for in and around 1.95 as well as GDX September 30 Puts for in and around 1.05.
SP-500 Setup Chart:

Prior Setup Chart:

SP-500 Setup Chart:

Prior Setup Chart:

ES
1627-1630 is where I switch bullish. Will be purchasing call options on IWM and SPY today. I'll also be picking up some GDX puts.
Monday, August 26, 2013
Gold - Time to short with Elliott Hedged Wave Count
The 1410 area on gold seems like a good opportunity to take profit on the long position and get short. The bullish count calls for a wave 2 pullback while the bearish count calls for a new low. Here's the setup chart:

The stop-loss on this trade is 1430 with an open take profit level.

The stop-loss on this trade is 1430 with an open take profit level.
Tuesday, August 20, 2013
EUR/USD - Stopped Out
We were stopped out of the EUR/USD position overnight for a 40 pip loss. Will re-evaluate the charts going forward, but I may be done with currencies until normal trading activity resumes.
Friday, August 16, 2013
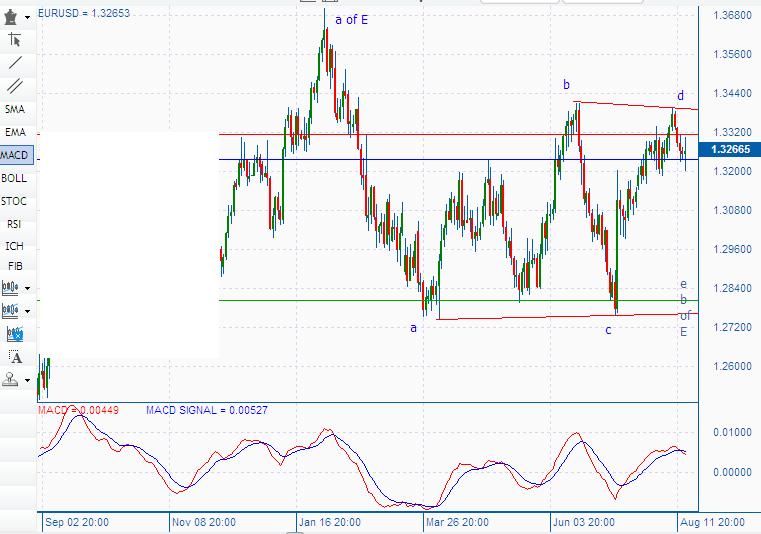
EUR/USD Update Lower Stop-Loss
It looks as if 1.33777 was the high of this move. If that is correct we should adjust the stop to just above @ 1.33800. This lowers our risk from 60 pips to 40 pips as well.
Chart:

Chart:

Thursday, August 15, 2013
Selling EUR/USD ATM
Sold EUR/USD @ 1.33400 with 1.34000 Stop-Loss and 1.28000 Take profit.


I have also entered a buy-stop order for EUR/USD @ 1.34200 in case this count is incorrect and we head up in wave 3 of C on our way to 1.45000. The OCO on that order is 1.28 Stop, 1.45 TP

TZA - Still holding ***Adjust Stop-Loss***
I put on a TZA position at 25.50 with a 10% Stop at 22.95. We should now raise that stop-loss to the previous low at 24.75. Our max risk now stands at 3%.
Tuesday, August 6, 2013
Book 1/4 Profits GBP/USD
Book 1/4 and let 3/4 run with breakeven SL. We booked 50 pips on this short term trade and I believe we'll get the rest of them.
Thursday, August 1, 2013
Facebook - 47.50 price target
I'm putting a 47.50 price target on FB which is about 25% higher than it's current trading level of 38.20. There is an Inverse Head & Shoulder Pattern (or cup and handle pattern if you want to look at it that way) whose breakout projects to that level. It is also the 1.618 fib extension of wave 1 or A.
Chart:

Chart:

AUD/JPY TRADE ALERT
Setting up a limit sell in AUD/JPY @ 89.30 with an 80 pip stop-loss at 90.10 and a take profit level of 85.25 for 405 pips. The risk/reward on this trade is 80/405 = .200, very very reasonable risk reward.


Based off the daily chart we completed wave iii of 5 and are now in wave iv of 5 that shouldn't exceed 89.70, but with a triangle in the i wave it's hard to tell where exactly wave i ended and ii began. Therefore we moved the stops up to the wave after the triangle completion. This adds about 30 pips of risk to the equation, but keeps the risk/reward ratio very favorable.

Here's the 2 Hour setup chart

Subscribe to:
Posts (Atom)