
Unbiased Forex and Equity Swing Trades
Tuesday, August 27, 2013
ES
1627-1630 is where I switch bullish. Will be purchasing call options on IWM and SPY today. I'll also be picking up some GDX puts.


Monday, August 26, 2013
Gold - Time to short with Elliott Hedged Wave Count
The 1410 area on gold seems like a good opportunity to take profit on the long position and get short. The bullish count calls for a wave 2 pullback while the bearish count calls for a new low. Here's the setup chart:

The stop-loss on this trade is 1430 with an open take profit level.

The stop-loss on this trade is 1430 with an open take profit level.
Tuesday, August 20, 2013
EUR/USD - Stopped Out
We were stopped out of the EUR/USD position overnight for a 40 pip loss. Will re-evaluate the charts going forward, but I may be done with currencies until normal trading activity resumes.
Friday, August 16, 2013
EUR/USD Update Lower Stop-Loss
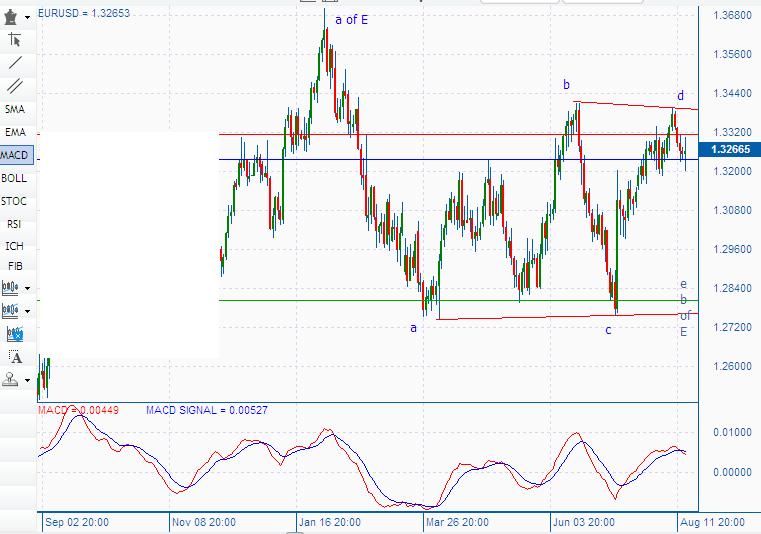
It looks as if 1.33777 was the high of this move. If that is correct we should adjust the stop to just above @ 1.33800. This lowers our risk from 60 pips to 40 pips as well.
Chart:

Chart:

Thursday, August 15, 2013
Selling EUR/USD ATM
Sold EUR/USD @ 1.33400 with 1.34000 Stop-Loss and 1.28000 Take profit.


I have also entered a buy-stop order for EUR/USD @ 1.34200 in case this count is incorrect and we head up in wave 3 of C on our way to 1.45000. The OCO on that order is 1.28 Stop, 1.45 TP

TZA - Still holding ***Adjust Stop-Loss***
I put on a TZA position at 25.50 with a 10% Stop at 22.95. We should now raise that stop-loss to the previous low at 24.75. Our max risk now stands at 3%.
Tuesday, August 6, 2013
Book 1/4 Profits GBP/USD
Book 1/4 and let 3/4 run with breakeven SL. We booked 50 pips on this short term trade and I believe we'll get the rest of them.
Thursday, August 1, 2013
Facebook - 47.50 price target
I'm putting a 47.50 price target on FB which is about 25% higher than it's current trading level of 38.20. There is an Inverse Head & Shoulder Pattern (or cup and handle pattern if you want to look at it that way) whose breakout projects to that level. It is also the 1.618 fib extension of wave 1 or A.
Chart:

Chart:

AUD/JPY TRADE ALERT
Setting up a limit sell in AUD/JPY @ 89.30 with an 80 pip stop-loss at 90.10 and a take profit level of 85.25 for 405 pips. The risk/reward on this trade is 80/405 = .200, very very reasonable risk reward.


Based off the daily chart we completed wave iii of 5 and are now in wave iv of 5 that shouldn't exceed 89.70, but with a triangle in the i wave it's hard to tell where exactly wave i ended and ii began. Therefore we moved the stops up to the wave after the triangle completion. This adds about 30 pips of risk to the equation, but keeps the risk/reward ratio very favorable.

Here's the 2 Hour setup chart

Subscribe to:
Posts (Atom)