

Unbiased Forex and Equity Swing Trades
Tuesday, December 16, 2014
Monday, December 15, 2014


Wednesday, December 10, 2014
SP-500 Watch out for running or expanded flat
Hedging my shorts with some Dec 20 206 Calls for tomorrow.

Tuesday, December 9, 2014


Wednesday, December 3, 2014

Monday, December 1, 2014
Swing Trend Indicator -Timing for 2014
Here's a 2014 Swing Trend Indicator Review:

There were some whipsaws in March-April that ate into some profits, but other than that it worked great.
There were some whipsaws in March-April that ate into some profits, but other than that it worked great.
Swing Trend Indicator - Tentative Sell
The Swing Trend Indicator went on tentative sell at today's close.

Monday, November 3, 2014
Swing Trend Long Sell Stops
Sell stops on the swing trend long trade from 1899 should be moved up to 2001.20. Short below 2001.20. This locks in 102 pts profit.
Wednesday, October 29, 2014
Short term update
A couple of indices went on short term sell today, but none of the indices went on the swing trend sell. Day traders can be short both SPY and QQQ with buy stops at the highs of 199.12 and 100.20.
The swing will go short on a break of 1951 on SP-500
The swing will go short on a break of 1951 on SP-500
SP-500 Sell Stop
The sell-stop on SP-500 should be moved up to 1951.37. If triggered will lock in 51 pts. profit. Also if triggered, you should be short with a stop at the most recent high.
Friday, October 24, 2014
1899 Buy Stop
You all should be profitable and long from your 1899 buy stop. That stop should've been moved down, but I didn't post that so I'll assume that's where we're long from.
The other buy indicators followed AFTER the buy stop. That's why it's better to look at multiple indicators and price at the same time. Some give better entries.
So where are we now?
The Swing Trend Indicator, after giving a buy signal last Friday, is now on full buy. The decline we experienced put almost all indicators in medium term, oversold territory. The rally thus far, as powerful as it has been, has yet to move many of these indicators. This means the decline we experienced was probably all of the 4th wave and we're heading up to SP-500 2120 before another vicious decline.
I will try to post some charts and in-depth analysis this weekend.
Schedule: Dogs @ Groomers 8 am, grocery shop, put groceries away, play with Chase, pick up dogs, drop dogs off, pay window cleaning people, pick up boat, pick up Nick, meet Paul at Mississippi launch 45 minutes away, fish the river and catch 20 different species, take pictures, drink beer, listen to Gopher game, have fun, pack up, drop off boat, drop off Nick, cook dinner for wife, play with Chase, put together new changing table, tighten bolts on shitty island kitchen chairs, watch a movie with wife(?)
Yup, life is easy.
Monday, October 20, 2014
Swing Trend Indicator
The Swing Trend Indicator gave a tentative buy signal and a trigger buy signal on Friday, October 17th.

Wednesday, October 15, 2014

Tuesday, October 14, 2014

Looking for indications of a bottom
I apologize for the lack of posts, been busy with the new house and child. Still figuring out my time management.
I am on the lookout for a medium term low, bounce, and then downside to resume.
Stop-losses on the SP-500 should be at 1899 with 1899 being a buy stop (meaning you should get long above 1899 with stop-losses set at the prior low).
The VIX barely closed back inside it's upper BB. A close below 22.79 tomorrow issues an equity buy signal:
 The RUT has entered into it's 4th wave FSZ (Fib Support Zone). Wave 4 =.382* wave 3 and wave 4 = wave 2. The ADX is nicely above the 40 line saying a trend reversal is due. There are two ways to trade the ADX, on a straight up rollover which has produced as much as 50 points drawdown before a reversal in the past, or by waiting for the ADX to dip back under the 40 line. The latter has produced 20 point max drawdowns. I can't rule out new lows, but I think new lows are buying opportunities.
Stops on the RUT should be at 1098:
 RSI on SPX/VIX is in an area that has produced lows before, although a touch of the 30 line gives better signals:

VIX/VXV over 1 should always have bears worried:
 The NYHLR was under .10 at one point:

I am on the lookout for a medium term low, bounce, and then downside to resume.
Stop-losses on the SP-500 should be at 1899 with 1899 being a buy stop (meaning you should get long above 1899 with stop-losses set at the prior low).
The VIX barely closed back inside it's upper BB. A close below 22.79 tomorrow issues an equity buy signal:
Stops on the RUT should be at 1098:
VIX/VXV over 1 should always have bears worried:
Tuesday, September 9, 2014
Intro to blog changed
The intro will now contain the market direction, my entry level and my stop-loss/stop buy/stop sell trades. The market direction will always be at the top of the page from now on. Market refers to SP-500. I will track the buy and sell signals and come up with profit/loss system based off this first short trade, which I think will probably get stopped out, but that's the purpose. I'm not thinking anymore, just following my system.
Wednesday, September 3, 2014
Sell Stops
Sell stop levels for top indices:
DJIA: 16,984.52
SP-500: 1994.85
Russell: 1164.11
Nasdaq: 4054.61
DJ Transports: 8368.33
If these levels are breached, I will be short with a stop at the highs to start.
DJIA: 16,984.52
SP-500: 1994.85
Russell: 1164.11
Nasdaq: 4054.61
DJ Transports: 8368.33
If these levels are breached, I will be short with a stop at the highs to start.
Monday, September 1, 2014
EUR/USD - Still Stalking a Long Position
Well the last attempt in catching the falling knife known as EUR/USD cost me 9K, but I've been tracking this pair and am highlighting another support level coming up.


EUR/USD 4 Hr. Chart:
ELLIOTT WAVE:
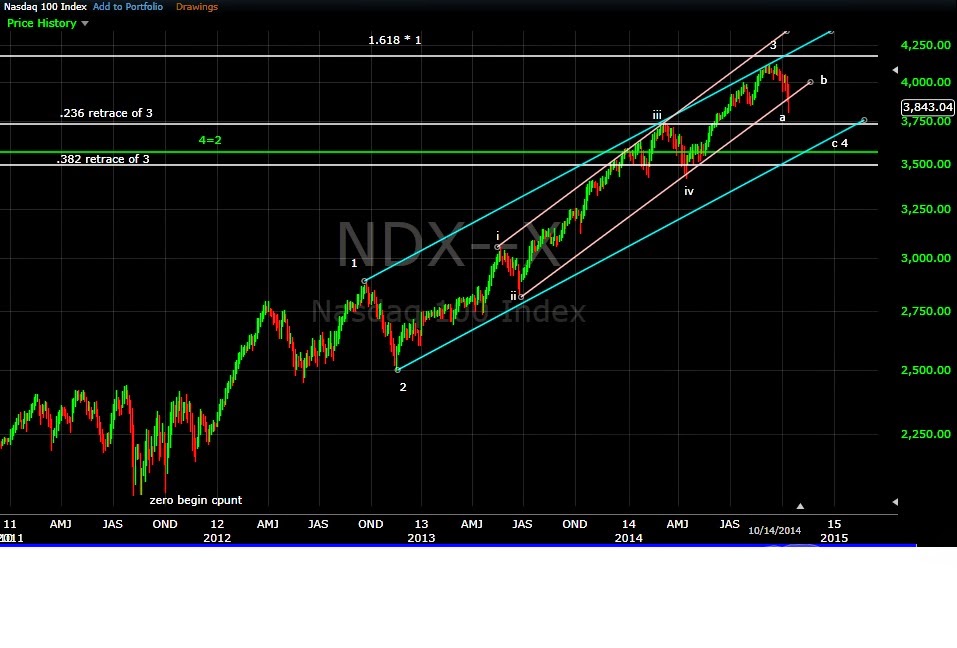
Wave 2 is related to wave 1. In this case, wave 2 retraced .618*wave 1, which is perfect.
Wave 3 is related to wave 1. In this case, wave 3 traveled 2.618*1, which is perfect.
Wave 4 should relate to both wave 3 and wave 2. In this case, wave 4 retraced .236*3 and 4=2.
The pair is still respecting it's down channel nicely, and the move from a triangle is generally the final move before a short term trend change. Wave 5 would equal 2.618* Wave 1 around the 1.30800 level. Wave 5 = Waves 1+3 around the 1.30600 level. This 20 pip range produces a strong fib support zone.
Since wave 3 was greater than 1.618* Wave 1, we expect wave 5 to be related to wave 1. Wave 5 under this scenario typically travels 1*1, 1.618*1 or 2.618*1. We are reaching the final level of the typical scenario. Additionally, having the fib support of wave 5 = waves 1+3 strengthens the case for a reversal in this area.
The moving averages on the chart help support the count. The MA's came together on waves 2 and 4, just what you'd expect corrections to cause.
EUR/USD 1 Hr. Chart:
On the 1 hr chart we can again see where the MA's come together, and since those are typical corrections, I will label them that way. I have limit buy orders in at 1.309000-1.306000, and buy-stops in at 1.31963.
Hopefully this trade works a little better!
Thursday, August 21, 2014
EUR/USD
Got long this morning with a 1.32400 stop-loss. First take profit level up in the 1.34200 area.
Current Price: 1.32700
Risk: 30 pips
Reward: 150 pips
R/R: 0.2
1 Lot Risk $300.00
1 Lot Reward $1500.00
Setup Chart:

Current Price: 1.32700
Risk: 30 pips
Reward: 150 pips
R/R: 0.2
1 Lot Risk $300.00
1 Lot Reward $1500.00
Setup Chart:
Tuesday, August 19, 2014

Wednesday, August 13, 2014
SP-500
The drop lasted around 10 days, so if we are in a correction, we should expect it to last .618*10 or 1*10 days which puts the reversal zone from Friday, August 15th to Wednesday, August 20th. The price zone should be 1950-60 with a buy stop at 1965.

Friday, August 8, 2014
What to Watch For
A retrace over the 61.8 retracement at 1958 and change (I round up and call it 1960) increases the odds of a new high to 85%. The plan is to reshort against 1965 (I give it some room) with a buy stop at 1965.01.

Thursday, August 7, 2014
PS Introducing Chase James

July 25th, 2014
.JPG)
0040 or 12:40 AM birth time, and not sleeping since Wednesday night for an hour, don't judge us.
.JPG)
F this.


Wednesday, August 6, 2014

Thursday, July 24, 2014
USD/NOK Holding Long Position
Daily Chart:

2 Hour Chart - Wave 4 Triangle Probably complete at wave 4=2 and 4=.236*3

2 Hour Chart - Wave 4 Triangle Probably complete at wave 4=2 and 4=.236*3
Tuesday, July 22, 2014
Wednesday, July 16, 2014

Tuesday, July 15, 2014
Swing Trend Indicator on SELL
The Swing Trend Indicator, as of this posting, is on full sell for the first time since the full buy signal on April 21st. This is an END OF DAY Indicator, so means nothing to me at this point.
Monday, July 14, 2014
Swing Trend Indicator
No full sell as of yet, it was close on Friday's close, but no signal. When the bottom set moves below the green line a correction should be at hand.

Thursday, July 10, 2014
Chart for kkandru
My analysis points to this market path. I can't post charts in the comment section.

Swing Trend Indicator
is on tentative sell as of yesterdays close.

I still believe we are targeting a touch of the 1987 projection line. We'll probably hit it around 2400 or so next fall.

I still believe we are targeting a touch of the 1987 projection line. We'll probably hit it around 2400 or so next fall.
Thursday, June 26, 2014
Bullish Complacency About to Turn Bearish

The equity put/call ratio is now below the level reached in January of this year. Once this turns up a correction is probably at hand.

The bullish percent index has put in indicator divergence on the new highs. The ADX is also at a level that when it rolls, should issue an equity sell signal.
We are close to the 20-40 pt. range that the SPX ADX signal issued a sell signal marking a top.

RSI negative div on SPX:VIX. RSI below 50 is generally not good for SP-500 (currently 52).
Friday, June 20, 2014
AUD/NZD Update
I was filled on my 1.0765 bid and am currently up 27 pips or so, or $220/contract. I am now upping my stop-loss on the trade to the actual low that was made at 1.07400 dropping the risk to 25 pips or $200/contract. I am maintaining the take profit level for now.
Wednesday, June 18, 2014
Nikkei - Clean Chart
The Nikkei has one of the cleanest looks. I am counting the current move up as the C wave of a 3-3-5 correction which should top out around the 15,400 mark with a chance to extend to 15,675. I am looking to enter some puts for January 2015 on the EWJ, strike 11, at these two levels on the Nikkei. The 50% time from the low on the chart to the high comes in the end of November, and the correction should take at least 50% I would think.

AUD/NZD Update
No fill yet on this pair, but it is hovering around my limit order. It is currently 30 pips lower than when I broadcast the trade alert, so my patience has paid off to the tune of $250/contract. Setting up trade parameters ahead of trades and being patient allows me to gain better entries with lower risk and higher reward while avoiding large drawdowns. That's a good lesson to learn.
Tuesday, June 17, 2014
AUD/NZD - Playing a Wave 4 Bounce
I'm going to be playing what I believe to be a wave 4 coming up in AUD/NZD from the 1.0765 fib support zone.

Trade Parameters:
Buy to open with 1.07650 limit order.
Stop-loss @ 1.07350
Take Profit @ 1.08600
Risk 30 pips / Reward 95 pips
Why the 1.08600 take profit level? Based off the entry point, which I believe will complete wave 3, a bounce to 1.08600 would make wave 4 = .382(3) and wave 4 = 2. It also also the area of the prior iv wave.
Thursday, June 12, 2014
SP-500 & QQQ
Both are within their FRZ and I'm shorting with impunity!
Better Q's Chart:


Also short FB
Better Q's Chart:
Also short FB
Subscribe to:
Posts (Atom)